At CommunityScale, we are constantly looking for new ways to integrate technology and innovation in our work. In particular, we bringing more of the planning process and outcomes into digital and online formats where they are more broadly accessible to our clients’ communities. This especially includes digitally native younger people and folks who can’t make a public meeting or don’t have time to read a long pdf.
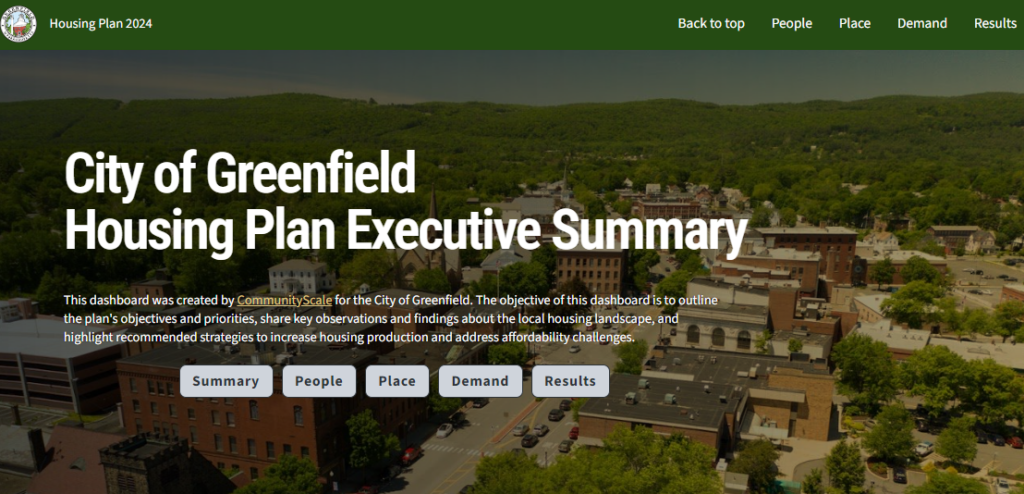
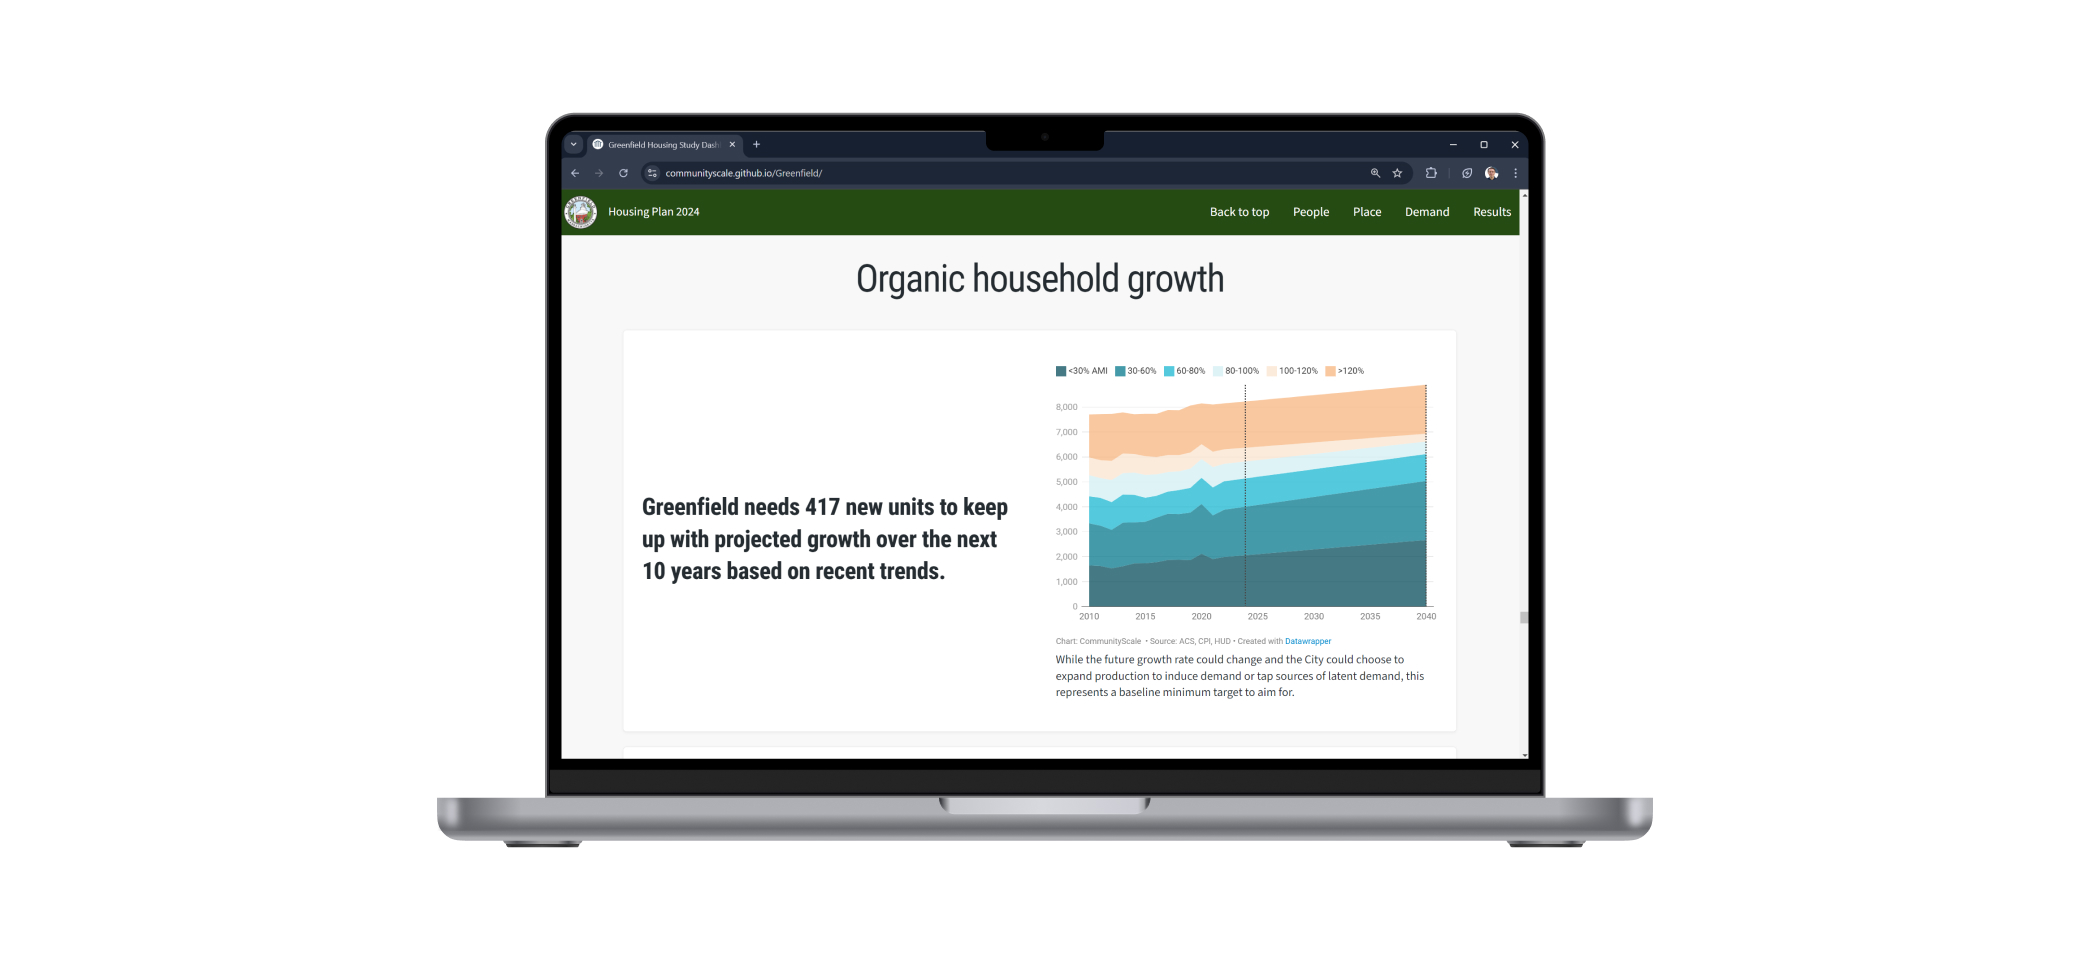
As part of this initiative, we’ve just introduced a new online dashboard product to complement our housing study services. This example from Greenfield’s Housing Plan represents the first of many we will be releasing over the coming months.

The dashboard concept includes several engaging elements that just aren’t possible in any other format:
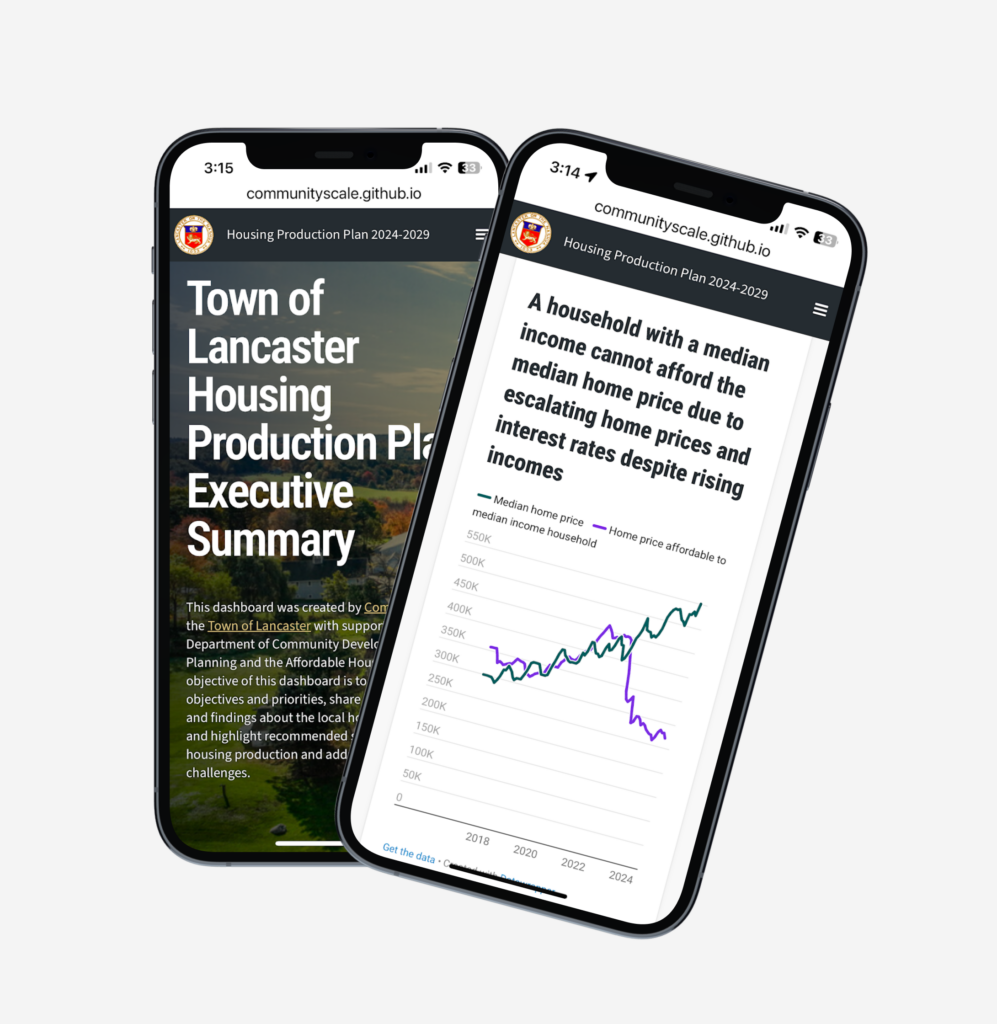
- Accessible from anywhere. We’ve designed the interface for both desktop and mobile devices so people can engage with the content any time, any place.
- Eminently shareable. Unlike a hefty pdf file that must be attached to an email or downloaded from somewhere, a hyperlink can be passed around with ease.
- Interactive and dynamic. Our dashboard includes charts that respond to clicks and taps along with interactive maps that viewers can explore.
- Live-updating. We offer a “progress tracker” element that integrates real-time data feeds to illustrate the community’s progress toward its housing goals. We can also give clients the ability to update metrics themselves over time with no coding skills necessary – just the use of a simple spreadsheet.
- Open source and transferrable. We’ve built the dashboard on GitHub with nothing but HTML and CSS so that it can easily migrate onto a client’s servers if desired – with no ongoing cost or complexity to manage.

Mobile screenshot of our Lancaster dashboard
We’re excited to roll out this new offering to our clients and look forward to following how it helps make important conversations about housing and policy more inclusive and engaging everywhere we work.
