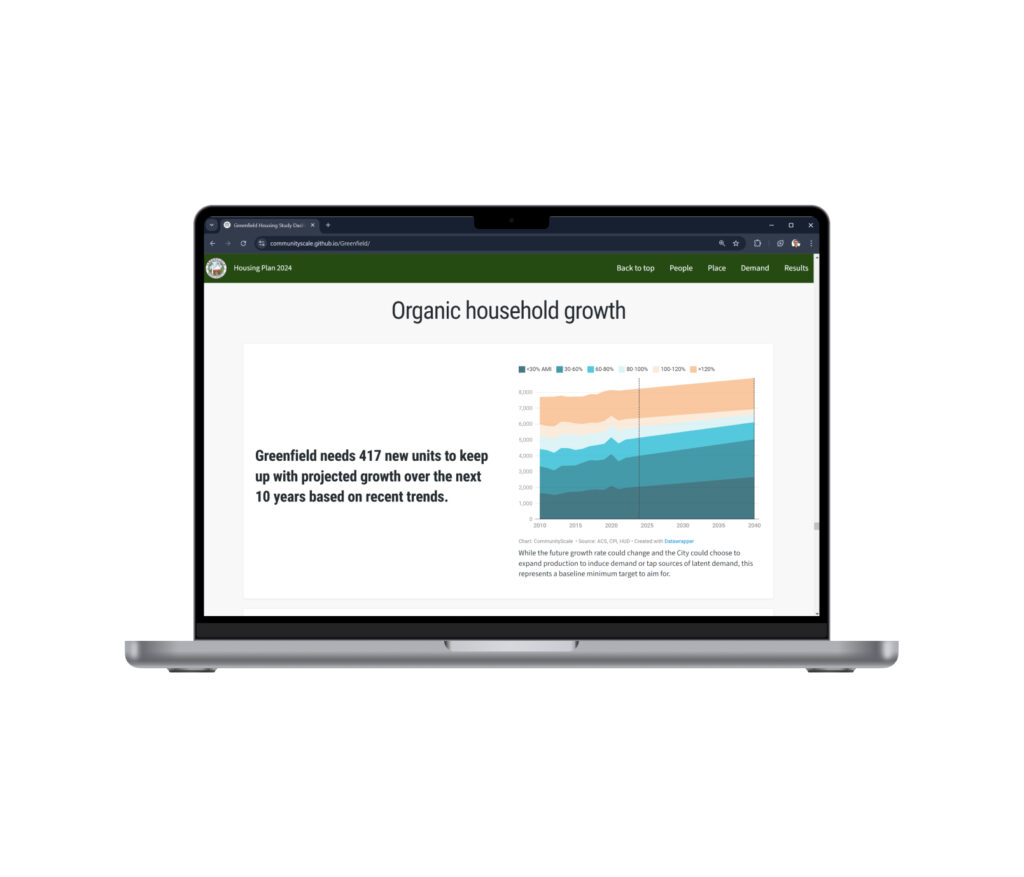
A new approach at a critical moment
Housing attainability and affordable new development have become challenges for nearly every community in the country. Housing needs assessments and market studies are foundational steps toward better strategies and policymaking to confront this mounting crisis – but only if they are delivered in ways that advance the conversation, fit within tightening budgets, and lead to results. An example report is accessible online.
Reliable inputs, useful outputs
The following are examples of our methodology’s core outputs.
Household forecast by income bracket
CommunityScale has a custom methodology for estimating the change in households by AMI that begins with the ACS households by income and incorporates inflation, HUD AMI, household growth forecasts to distribute the future estimated AMI levels over the expected growth. This approach is a powerful way of understanding the trends in relative income level as well as overall number of households, which can then be used to make informed choices about optimal housing production types for a given area.
Read more about the methodology from this example
1. Raw data: Access ACS 5-year B19001 HOUSEHOLD INCOME IN THE PAST 12 MONTHS for all available years.
2. Inflation adjustment: Inflation-adjust the income brackets from current-year dollars to 2024 dollars (based on CPI) and then proportionally rebin the B19001 data.
3. Conversion to AMI levels and forecast: Convert income brackets into current year AMI levels (based on HUD) and rebin the inflation-adjusted B19001 brackets into AMI level, then calculate the slope of each AMI level to latest year to estimate the future share of households per AMI level.
4. Overall household growth forecast: Use the slope of growth, regional allocation, or production target as the overall new households number.
5. Final result: Proportionally allocate the estimated total households by the estimated AMI levels from step 3 to the overall household number from step 4 for each year.
Cost burdened households by income bracket
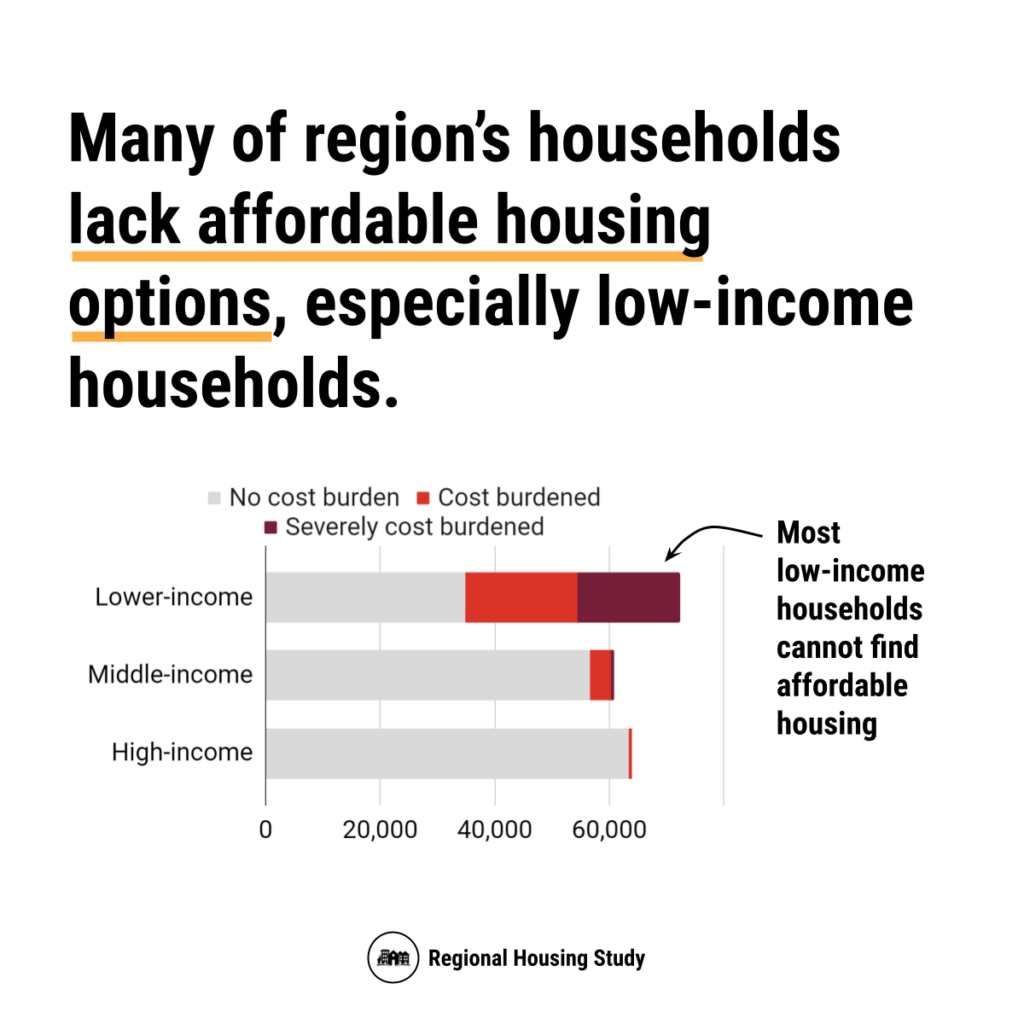
ACS's fine-grain data on household income by gross rent and selected monthly owner costs as a percentage of household income along with rebinning based on HUD AMI is the basis of communicating cost burden in terms that are useful for planning housing programs to address individual income levels. Higher cost burden indicates a shortage of affordable housing options. Households are cost burdened when paying more than 30% of their income on housing costs. They are considered severely cost burdened when these costs exceed 50% of their income. For renters, this includes lease rent and utilities. For homeowners, this includes mortgage costs, property taxes, insurance, utilities, and any condo fees.
Underproduction adjustments
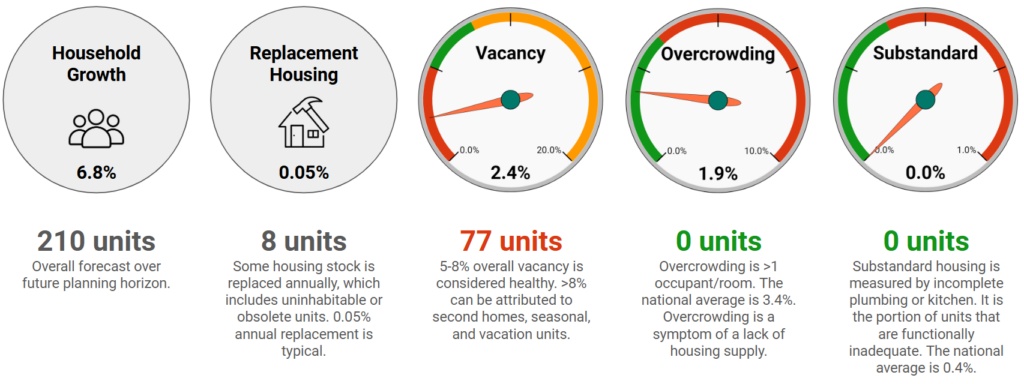
In this stage we translate our findings from households to housing units. In addition to household growth, every local market should maintain sustainable vacancy rates and offer hospitable housing stock to best serve community residents. Supplementary housing production is often necessary to keep each of these indicators in a healthy range. Drivers of housing production are household growth and a some replacement housing. Vacancy rate, overcrowding rate, and substandard housing rate are considered as well in relation to underproduction.
Affordability gap in real dollars
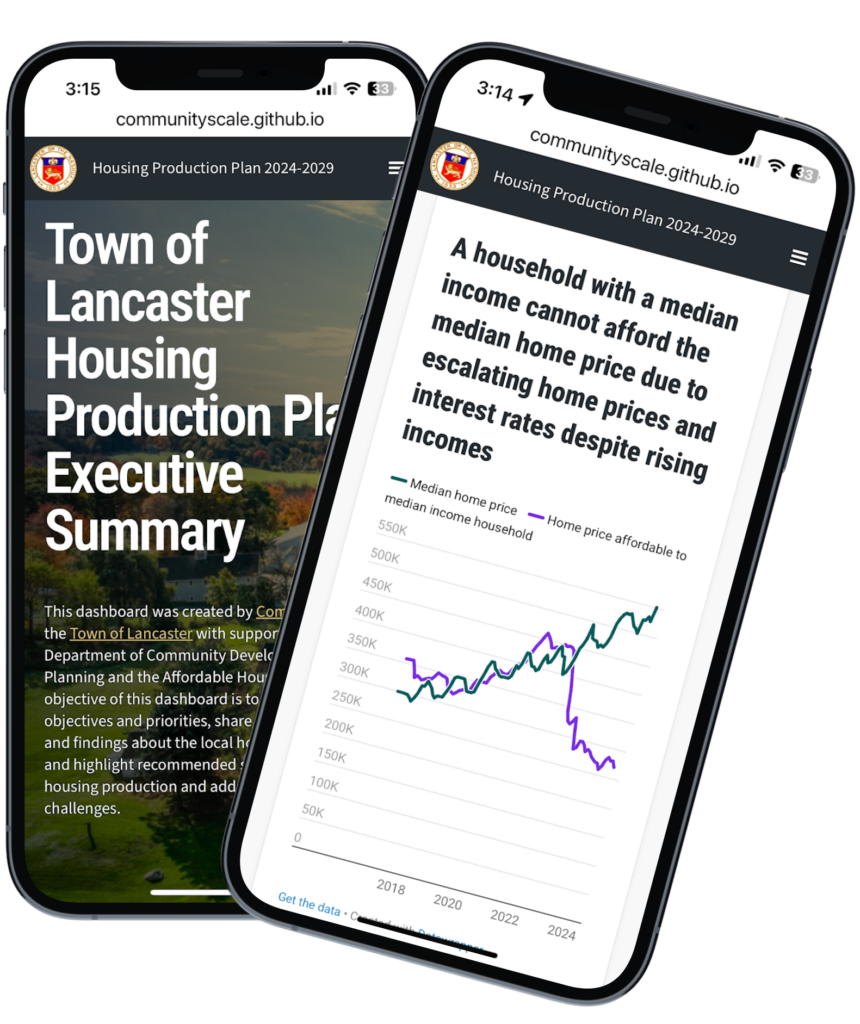
We've built a tool to track housing affordability and attainability in real time. We pull from Zillow for median home price, Census for median household income, and FRED for the latest mortgage rates With some local constants around insurance and property tax, we're then able to estimate the gap between what the median household can afford to buy and the median sales price for a given area. A wider gap means higher barrier to entry for first-time homebuyers and increased risk that an existing resident might be priced out of the community if they choose or need to move to a different house.
Mapping products
CommunityScale uses a combination of static and interactive maps to communicate spatial dimensions of housing.


Digital products
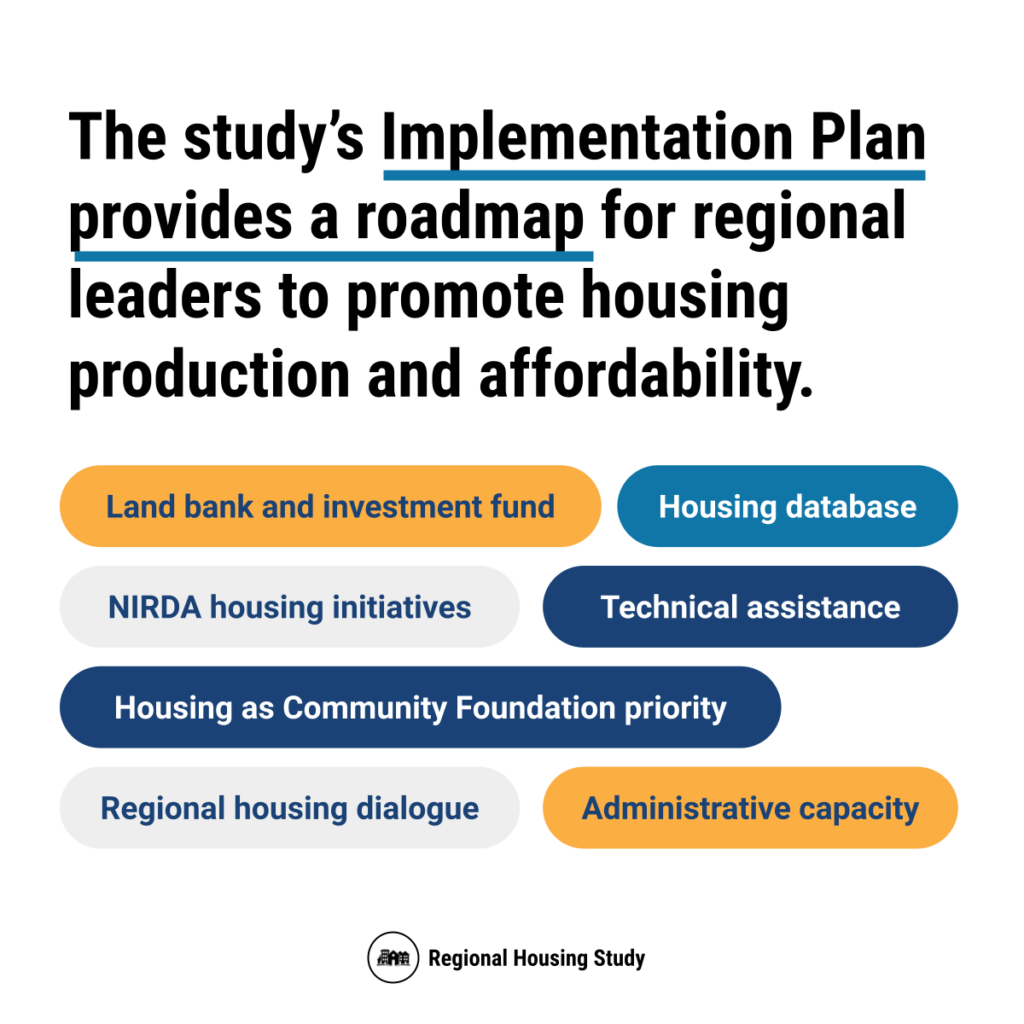
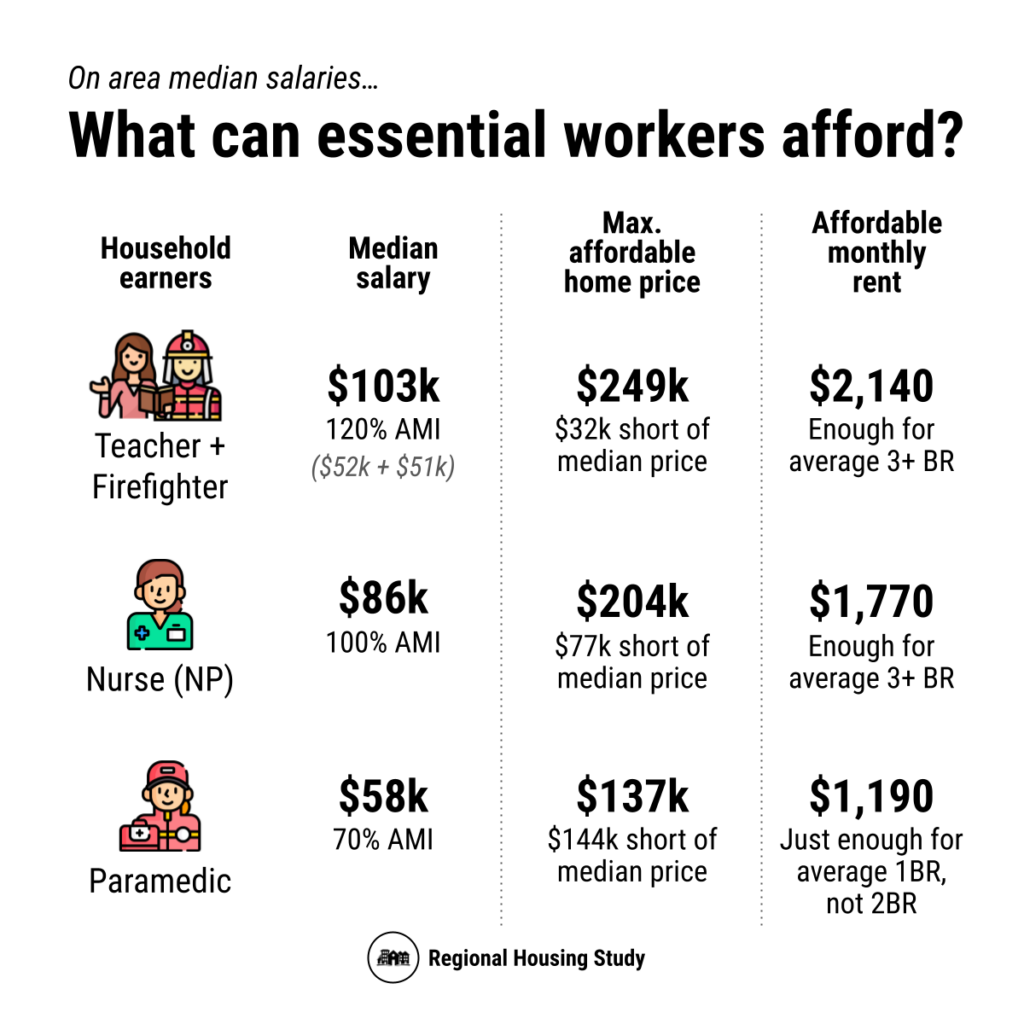
CommunityScale focuses on communicating the analysis outputs in ways that can educate, inform, and influence change. To achieve those goals, our approach is to meet people where they are, which includes our suite of digital products - social media and mobile-friendly dashboard development. Here are some examples of our digital communication.
