Gauging demand for new market-rate housing development can be challenging, especially in communities where it may not be prevalent (yet). Our innovative approach to “target“ housing market analysis is designed to help communities identify bankable opportunities for new development.
As part of a balanced housing and economic development strategy, many communities are interested in fostering more market rate housing development. This can complement efforts to bolster the affordable housing stock and also inject new investment into the economy and tax base. However, it can be challenging to attract market rate developers and program new projects without recent local comparables to reference and help justify the investment.
Our approach looks at the purchasing power of buyers and renters in the broader regional market today and tailors development plans to attract them from both within and also outside the local community. This “target market” approach has a long track record of success in the planning and development field, helping catalyze first waves of new development and revitalization in communities and neighborhoods across the country. It is also helpful when recent local comparables are hard to come by.
The following steps detail how we approach this “target market” strategy and quantify market rate housing demand for a community or project site.
1. Define the market area
What are the extents of a community’s broader real estate market? In other words, when someone in the area is looking for new housing, what is the geographic range they are likely considering? This represents the context for our housing market analysis.
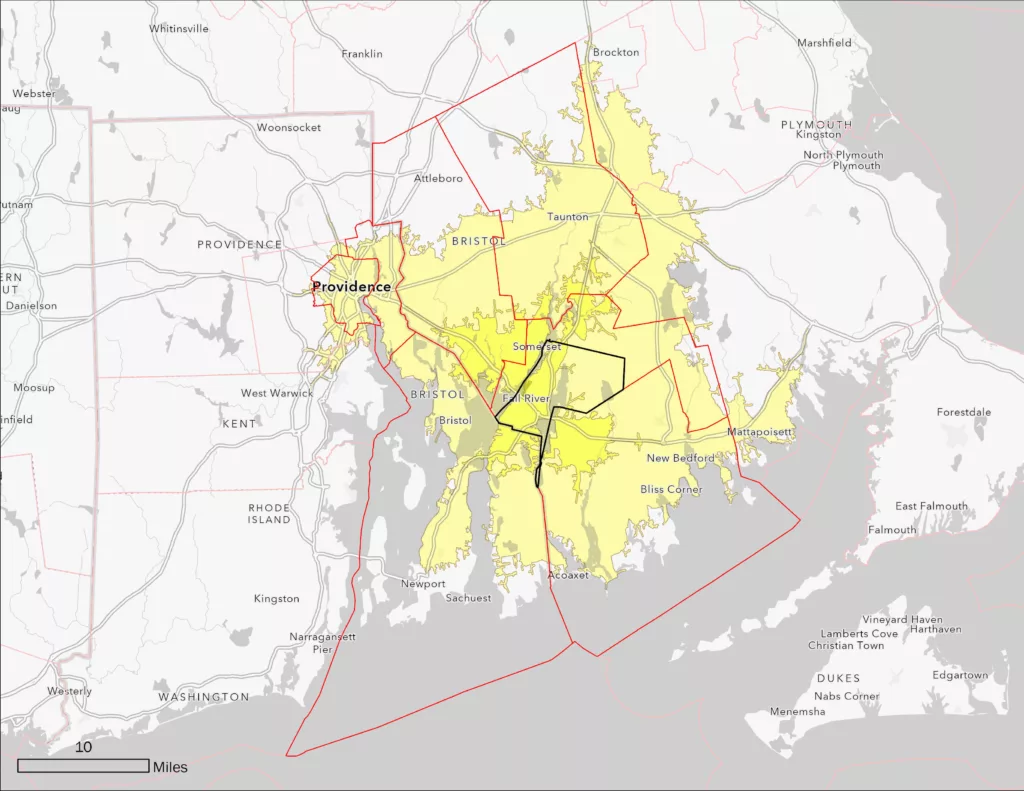
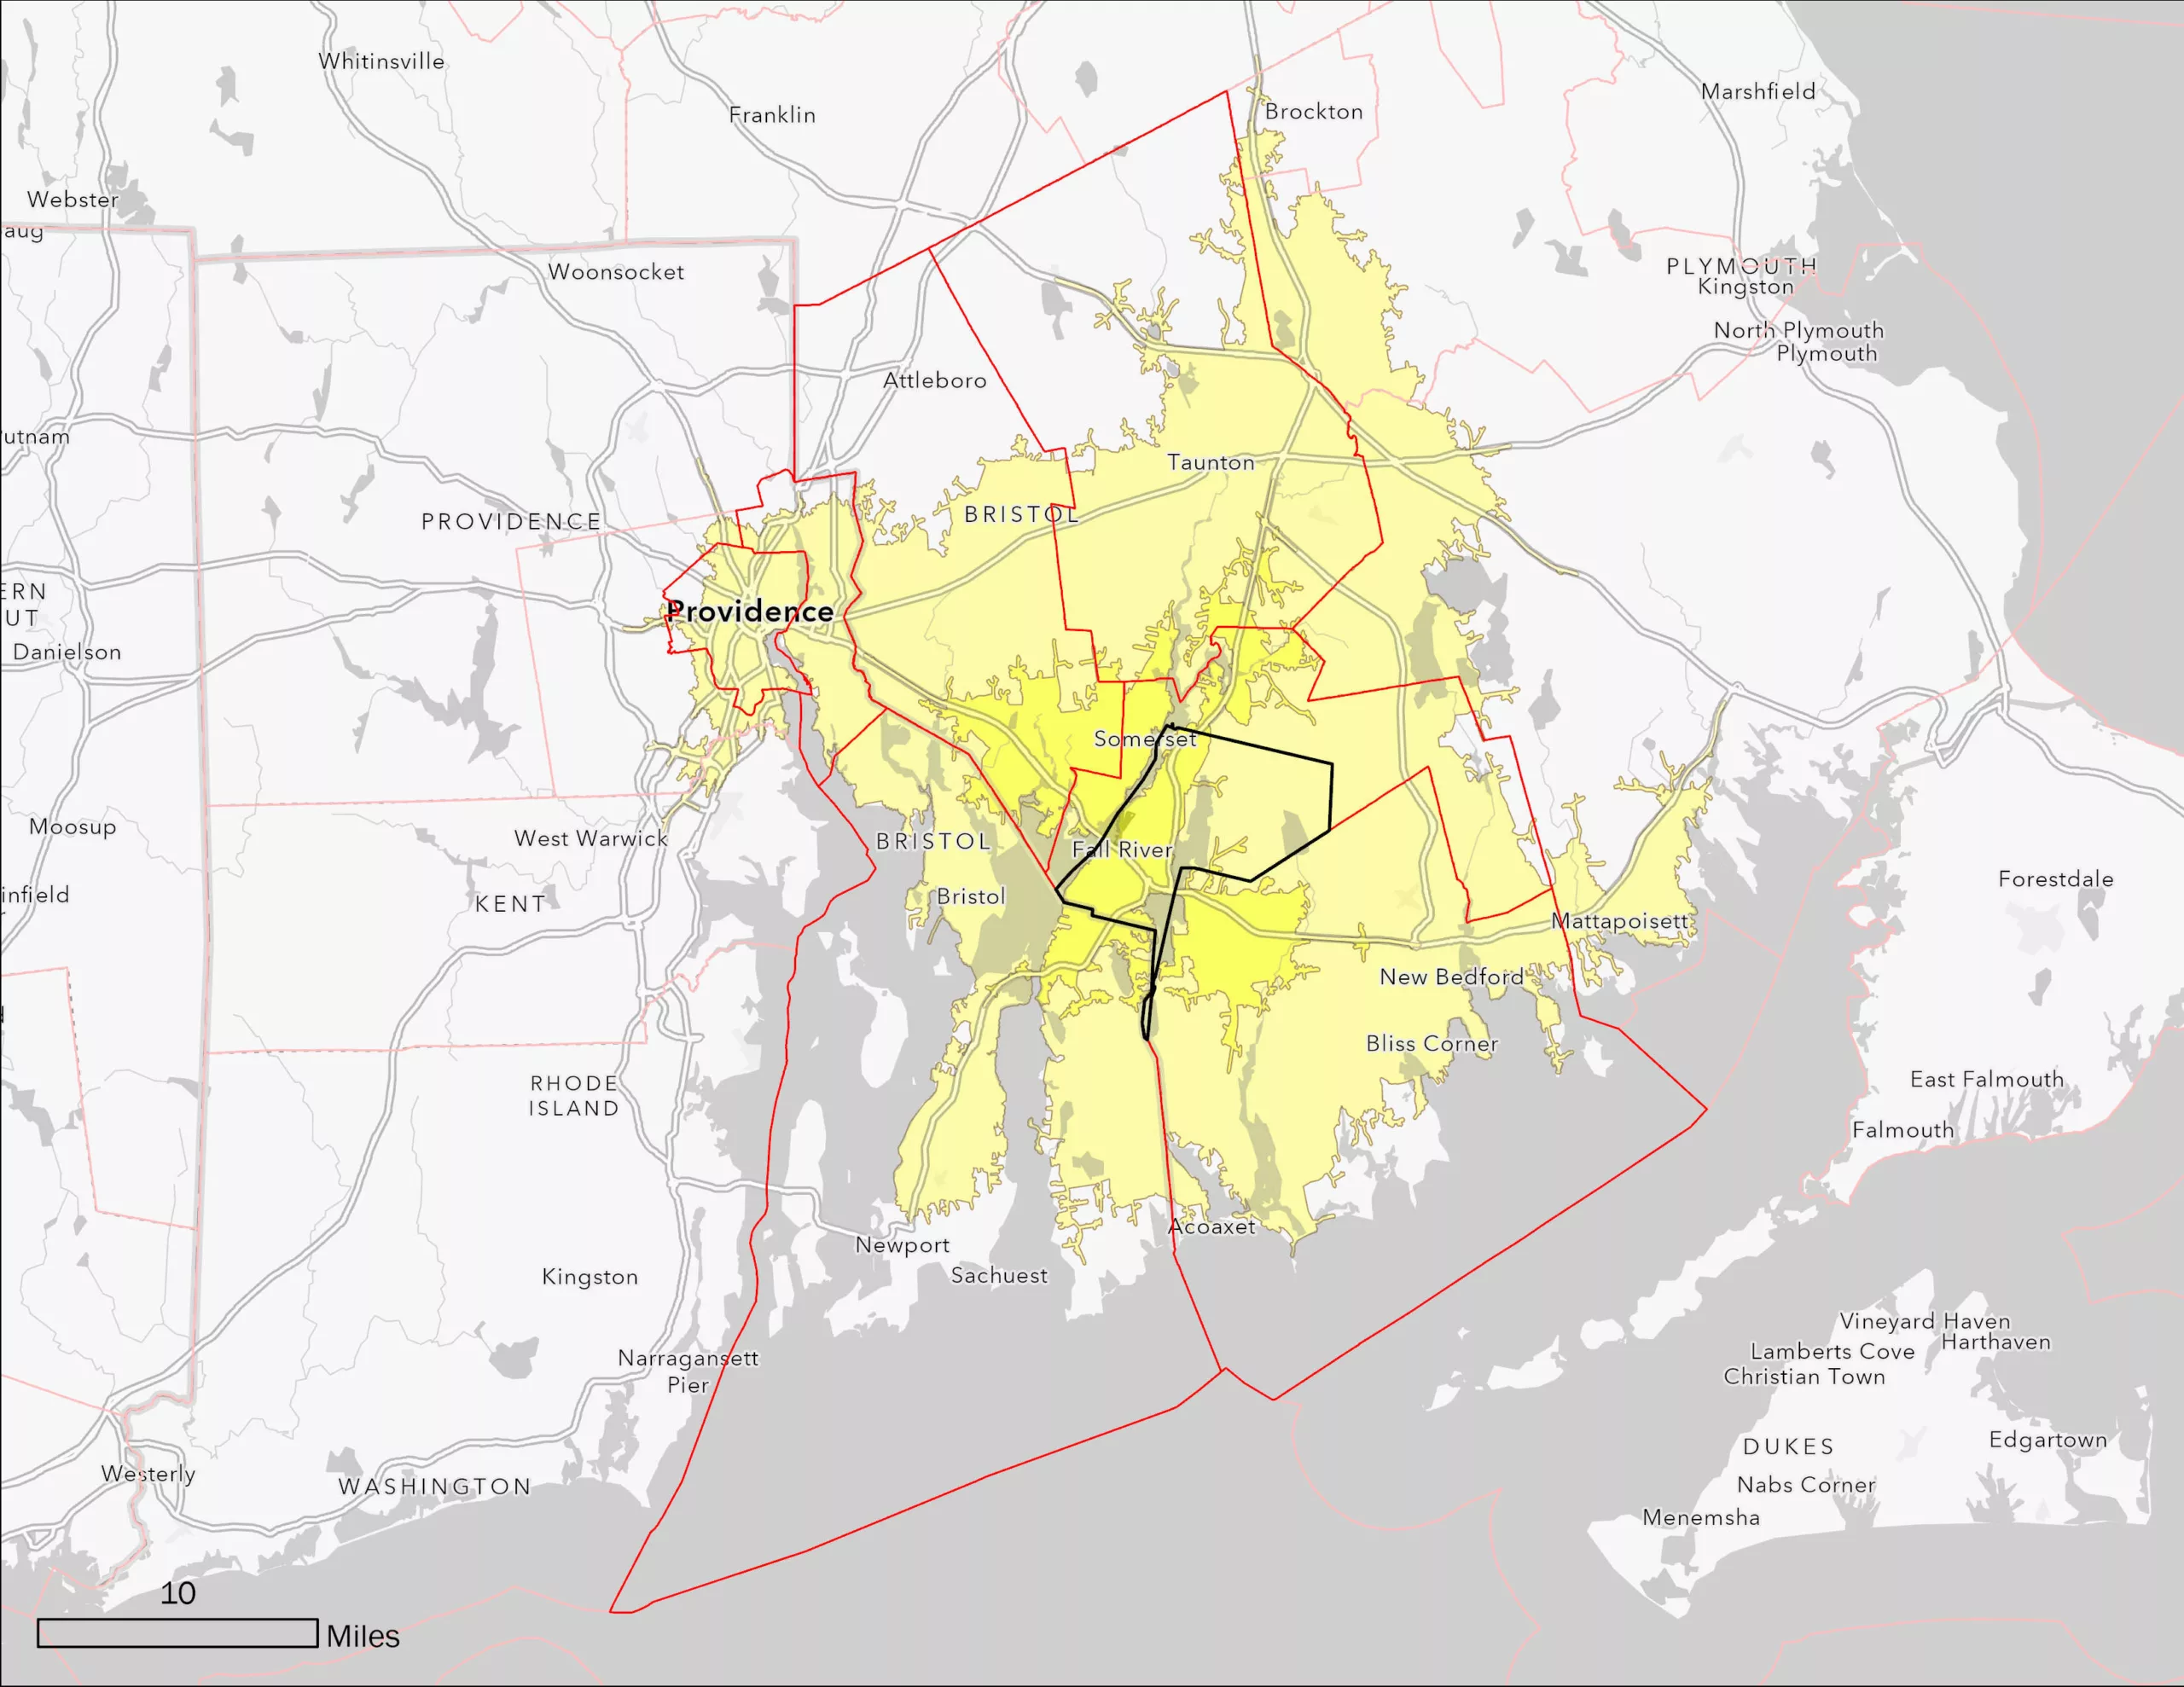
Though the actual contours may vary from place to place depending on local characteristics and dynamics, we start defining the market area by drawing a 30-minute driving radius around the community or project site we are focused on. Where possible, we also ask local developers and real estate professionals for their opinion of the market extent based on where they have observed potential buyers and renters originating from. Other factors such as transit networks can also play a role.
We often align our market area with Census PUMA (Public Use Microdata Area) boundaries to take advantage of the detailed information PUMS provides. In cases where our driving radius only includes portions of PUMAs, we will include those that are at least 50% covered.
2. Quantify the market population
Who are the people making new housing choices within the market area? What are their incomes and ability to pay for housing? These households are the potential buyers and renters new development would hope to capture.
We count households who recently moved into or within the market area to understand how large this pool of buyers and renters tends to be each year. From there, we take the average number of recently moved households over the previous several years for an accurate picture of the demand.
We also measure this group’s purchasing power to understand how much they would be willing to pay for new units. We subdivide the households by income so we can parse potential demand by a distribution of potential price points later in the analysis.
These operations provide the number of people new development could attract and the price points they can afford.
Model the market’s housing preferences
What types of housing do today’s renters and buyers want? How much are they willing to pay? We apply our unique housing preference model to the market population to find out.
While our data show us what housing choices these recent movers have been making over the years within the market area, we don’t consider this a reliable representation of future demand because it is constrained by the housing stock that happened to be locally available when they were looking. It is easy to imagine at least some households would have made different choices if more options were available so we should not necessarily put too much stock in the choices they ultimately settled for.
By zooming out to a broader geographic scale that encompasses multiple markets and even multiple states, we can see past these local constraints and more accurately characterize patterns of housing choices relative to income level and household size within the broader region of the country. This informs a predictive preference model we can apply to local populations to estimate the housing choices each household would make if their preferred unit type and price point were made available.
See this post for more details on this step.
4. Characterize potential housing demand
What are potential buyers and renters in the market area willing to spend on housing? What types of units are they looking for? We can answer these questions by applying our predictive housing preference model to the local market population.
In step 2, we estimated how many households are looking for housing within the market area and organized this population by income. In step 3, we modeled the distributions of unit types and price points typical households in this region choose based on their incomes. By combining these steps and applying the regional preference model to the local market, we can predict housing demand by volume, price point, and unit type on an annual basis.
As noted above, this analysis does not necessarily predict what units these households will actually choose because, in reality, their choices are constrained by the units available at the time. To the extent the modeling indicates demand for units that are not actually available, such results can be interpreted as unmet demand for new development.
5. Set the capture rate
How much of this total housing demand could a given community attract if it offered the right mix of housing types and price points?
All else being equal, prospective buyers and renters in the market area will settle across the area’s cities and towns proportional to their relative sizes. The larger places will attract a larger share of the demand and the smaller places a smaller share. Our default assumption is, therefore, that a community could capture a share of the potential market that is proportional to its share of the market area’s total household population (community’s households as a share of the total market area’s households).
However, this capture rate is contingent on the community actually providing enough housing units of the types and prices the market demands. If it offers less than its share of attractive unit types, it will capture less than its share of the market. Conversely, if it offers an outsized share, it could be positioned to capture proportionally more demand and support more redevelopment than its neighbors in the market area. For example, a community executing on an ambitious vision to revitalize its downtown area into a walkable, amenity-rich neighborhood environment with diverse housing choices could plan for a capture rate that exceeds the status quo.
To formulate the right capture rate for a given community, we combine the quantitative analysis of market and mobility trends described above, our qualitative assessment of the community’s built environment, and the degree to which the community is planning strategic investments in market catalysts like placemaking, walkability, and amenities that might increase its capture rate over time.
6. Identify the market rate price point threshold
To what extent does estimated demand support market-rate construction? How can this information be used to program a new development? We work with developers to parse market-rate components from the overall demand data.

The housing market analysis methodology described above quantifies potential demand across the full spectrum of unit sizes and monthly costs. However, in many cases, a community or developer is specifically interested in understanding demand for market-rate development that could be built with minimal or no public subsidy. This requires identifying the pricing threshold above which local developments can self-finance. What are the minimum rents or for-sale price a developer would have to charge to make a project work without requiring public support given the local construction costs?
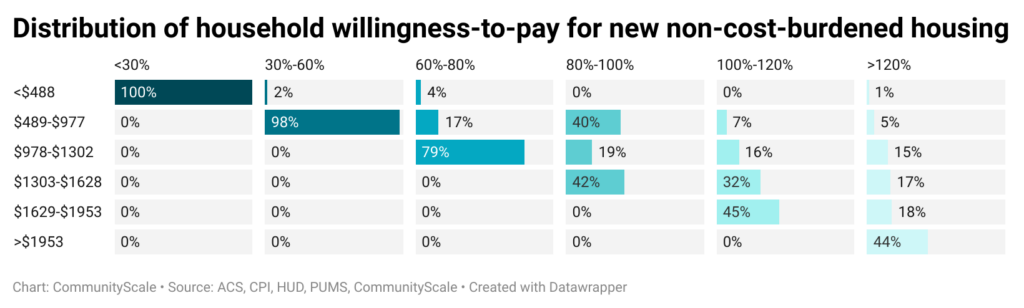
By default, we refer to recently built market-rate comparables to estimate the rental rates and sale prices necessary to support unsubsidized construction. We can augment this data with insights from local developers, realtors, lenders, and other real estate industry professionals through interviews and focus groups during the study process. We annotate our final demand capture table with a line indicating the pricing thresholds above which new development is potentially possible without subsidy (green shaded region of table above).
To apply this information to a specific development program, we can isolate the demand assessment to the unit types that would be most appropriate for the project given its scale, location, and construction typology. For example, a dense multifamily development in an urban downtown setting might focus on the 1- and 2-bedroom demand segments. A single family neighborhood development may focus on the 3- and 4-bedroom segments.
7. Scale the findings
How should communities think about this demand over multi-year planning horizons? Our demand findings represent potential absorption – to realize this demand, communities have to build it!
We present our target housing market analysis demand findings in terms of a potential annual absorption rate. In other words, the community could expect to absorb up to this many units of these types and price points per year to the extent they are made available. Plans extending several years could absorb new housing at these annual rates across multiple phases of implementation.
And this is where we hand the reins back to our clients: now that we know how much market-rate demand is out there, it’s up to the community and its developer partners to build the units and capture the opportunities we’ve uncovered together.
Next steps after the market study
- Audit local zoning to gauge whether targeted development is allowable in terms of use, height, density, parking, and other parameters.
- Promote the study’s findings to the local and regional development community to attract interested investors.
- Assess municipality-owned land holdings in case there are underutilized public properties that could be offered as sites for new development.
- Engage the community to share the study’s findings and build support for any regulatory changes that might be necessary to enable new development.
- Identify priority areas within the community to site new development and conduct planning exercises to establish design and placemaking guidelines that will help ensure new buildings fit into existing neighborhoods.